As with birth rates, we use data for 4 categories of countries from 1990 to 2015 (100 observations total). We have two explanatory variables, AGE and Y, where AGE is defined as the percentage of the population aged over 65 and Y is per capita GDP.
After eyeballing the scattergrams, we test the following functional form:
d = (minY^a)/Y^a * (1/AGE^g)
Where minY is the constant equal to the smallest value of Y in the series.
Logarithmic transformation gives:
ln(d) = ln(minY^a) – a*ln(Y) – g*ln(AGE)
which we test on the data using OLS. Here are the results:
Adjusted R square: 75.191
Intercept coefficient: 7.37384
t-Stat: 20.4011
Y coefficient: -1.01444
t-Stat: -13.1059
AGE coefficient: 2.0097
t-Stat: 11.5208
The estimated intercept is a good, but not perfect, approximation of ln(minY^a)
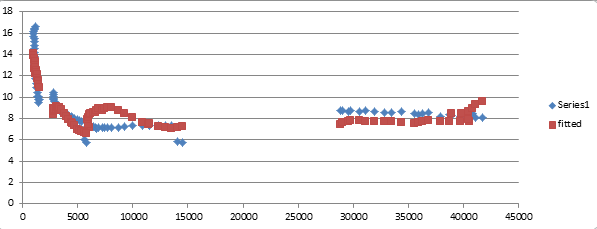
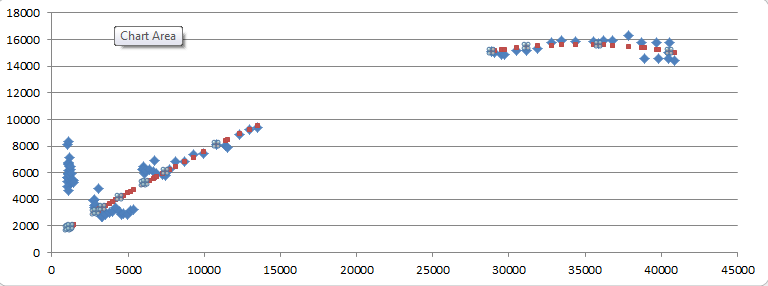
Here are the fitted against actual values of the scattergram for death rate against per capita GDP:

While the results are not as good as with the birth rates calculations, it is nevertheless a good enough fit and the explanatory variables have a strong enough confidence factor to be usable in our estimations.


