Skip to content
Graham Stull

Graham Stull

  • About
  • Books
    • The Hydra
    • The Fortune Teller
  • Poems
    • What is life?
    • Take me back
    • Eulogy for a Dungeon Master
    • Bratislava in the Rain
    • On the afternoon of my very last exam
    • L’hymne national d’Elodie
    • Help Wanted
    • The Marriage Poem / Das Ehegedicht
    • Office Blues
    • Poet’s Job Description
  • Dear Daniel
    • Happy New Year (15th letter)
    • Happy Holidays, my son! (14th letter)
    • Enjoy the sunshine (my 13th letter to you)
    • Bonne Année 2021 (12ieme lettre)
    • Bonne vacances d’ete (11ieme lettre a toi)
    • Cher Daniel, ma dixième lettre a toi
    • Joyeuses fetes, mon cher fils! (Ma 9ieme lettre)
    • Cher Daniel, ma huitieme lettre a toi
    • Lettres en anglais (plus vielles)
      • My first letter to you
      • My Third Letter to You
      • My fourth letter to you
        • My Second Letter to you
      • My Fifth Letter to You (Merry Christmas!)
      • My sixth letter to you (Happy Birthday)
        • Happy Easter Daniel
      • My seventh letter to you
  • Contact

Month: August 2018

My Review of Hideo Yokoyama’s “Six Four”

Continue reading “My Review of Hideo Yokoyama’s “Six Four””

Author GrahamPosted on 5th August 2018Categories Book ReviewsLeave a comment on My Review of Hideo Yokoyama’s “Six Four”

Quote of the Day

  • Sanity is just the average of all the different kinds of crazy.

Categories

  • Art
  • Book Reviews
  • COVID
  • Dear Daniel
  • Economics
  • Ireland
  • Media
  • Poetry
  • Politics
  • Quote of the Day
  • Random musings
  • The Hydra
  • Uncategorised

Archives

  • March 2023
  • February 2023
  • January 2023
  • December 2022
  • November 2022
  • October 2022
  • May 2022
  • April 2022
  • January 2022
  • December 2021
  • November 2021
  • October 2021
  • September 2021
  • August 2021
  • July 2021
  • June 2021
  • March 2021
  • February 2021
  • January 2021
  • November 2020
  • October 2020
  • July 2020
  • May 2020
  • April 2020
  • March 2020
  • January 2020
  • December 2019
  • July 2019
  • May 2019
  • March 2019
  • August 2018
  • July 2018
  • April 2018
  • March 2018
  • January 2018
  • December 2017
  • October 2017
  • September 2017
  • August 2017
  • July 2017
  • June 2017
  • May 2017
  • April 2017
  • January 2017
  • November 2016
  • September 2016
  • August 2016
  • July 2016
  • June 2016

Meta

  • Log in
  • Entries feed
  • Comments feed
  • WordPress.org
  • About
  • Books
    • The Hydra
    • The Fortune Teller
  • Poems
    • What is life?
    • Take me back
    • Eulogy for a Dungeon Master
    • Bratislava in the Rain
    • On the afternoon of my very last exam
    • L’hymne national d’Elodie
    • Help Wanted
    • The Marriage Poem / Das Ehegedicht
    • Office Blues
    • Poet’s Job Description
  • Dear Daniel
    • Happy New Year (15th letter)
    • Happy Holidays, my son! (14th letter)
    • Enjoy the sunshine (my 13th letter to you)
    • Bonne Année 2021 (12ieme lettre)
    • Bonne vacances d’ete (11ieme lettre a toi)
    • Cher Daniel, ma dixième lettre a toi
    • Joyeuses fetes, mon cher fils! (Ma 9ieme lettre)
    • Cher Daniel, ma huitieme lettre a toi
    • Lettres en anglais (plus vielles)
      • My first letter to you
      • My Third Letter to You
      • My fourth letter to you
        • My Second Letter to you
      • My Fifth Letter to You (Merry Christmas!)
      • My sixth letter to you (Happy Birthday)
        • Happy Easter Daniel
      • My seventh letter to you
  • Contact
Graham Stull Proudly powered by WordPress

As with birth rates, we use data for 4 categories of countries from 1990 to 2015 (100 observations total). We have two explanatory variables, AGE and Y, where AGE is defined as the percentage of the population aged over 65 and Y is per capita GDP.

After eyeballing the scattergrams, we test the following functional form:

d = (minY^a)/Y^a * (1/AGE^g)

Where minY is the constant equal to the smallest value of Y in the series.

Logarithmic transformation gives:

ln(d) = ln(minY^a) – a*ln(Y) – g*ln(AGE)

which we test on the data using OLS. Here are the results:

Adjusted R square: 75.191

Intercept coefficient: 7.37384
t-Stat: 20.4011

Y coefficient: -1.01444
t-Stat: -13.1059

AGE coefficient: 2.0097
t-Stat: 11.5208

The estimated intercept is a good, but not perfect, approximation of ln(minY^a)

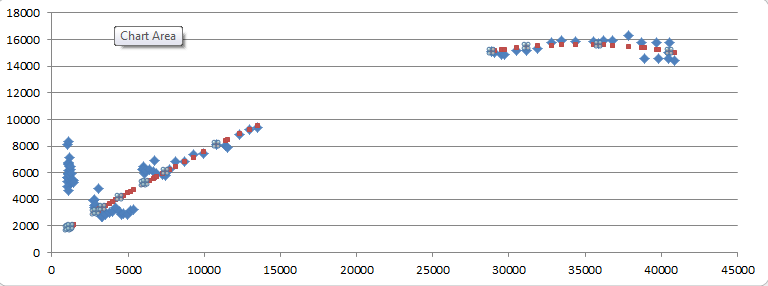
Here are the fitted against actual values of the scattergram for death rate against per capita GDP:

fitted-death-rates-against-actual-values

While the results are not as good as with the birth rates calculations, it is nevertheless a good enough fit and the explanatory variables have a strong enough confidence factor to be usable in our estimations.

×

We begin by examining the scatter of data for 100 observations of per capita GDP and per capita emissions for 4 categories of countries, over 25 years (1990 – 2015).

The scatter suggests a cubic functional form, so we test:

GHG = a + b*Y + c*Y^2 + d*Y^3

where GHG are per capita emissions of GHG, and Y is per capita GDP.

The results from OLS regression are:

Adjusted R square: 0.980438073

coefficient a: 1090
t-stat a: 3.06

coefficient b: 0.709310153
t-Stat b: 8.241453

coefficient c: -0.0000047025
t-Stat c: -1.01233

coefficient d: -0.000000000105314
t-Stat d: -1.47005

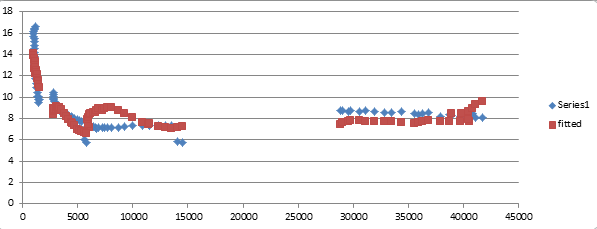
While the t-scores on the squared and cubed terms are low, the number of observations are also limited.

Here is the plot of the fitted against actual values:

fitted-emissions-to-gdp-against-actual-values

×