It has been a while since I’ve written to you, but that is not to say I have stopped thinking about you. Oh, not at all. On the contrary, you are in my thoughts every day.
I hope now that the evenings are getting brighter you will have a chance to play outside a little bit more. The parks are certainly bustling these day. When I collect your little sister from creche I often stop at the park and she watches the big boys and girls playing on their scooters, bikes and roller skates. She’s eager to get going too, but at 22 months still too small for that kind of thing.
It’s Lent now, which is a good period of the year to reflect on things and take stock of the good. It’s sort of a spiritual springtime! I am using this time to try and get back in shape – lots of running in the morning and playing tennis.
How is your tennis going? I hope you are improving. One day, perhaps, we can go out to the courts together and play a few games. My backhand is still kind of weak but I have quite a strong forehand and a decent enough serve.
Anyway, enough for now. I recorded a little video message for you before Christmas. Hopefully you have had a chance to watch it.
I came across this poem that I’d written ten years ago to mark the passing of Gary Gygax – creator of Dungeons & Dragons
Eulogy For A Dungeon Master
Countless the basements
You transformed to caverns;
Nameless the kitchen tables
fabled, formed as tabled taverns
Where a pimply 16 year old
Did his best
to bluff the role
Of rugged half-elf grimly
Assigning the next quest or tale
From o’er the rim
Of a dinted pint of frothy ginger ale.
We saw not the chinks
In our own teen-male armour
Nor did we stop to think
If days of playing roles might harm our
Hold on a real world so much more alarming
Than a hoard of charging orcs.
For in that four foot table space
Of paper, dice and figures made of lead
There thrived a truly magic place
where teenies meek were brave instead.
No slick slew of game designers needed we
No 3-D graphics, LANs or fancy Wiis.
With one hardbound spellbook you made the spark
That filled our teenage years with something more
than boredom and a high school pecking order.
Maybe your DM’s rolled a 20 now
Or just grew up and found
a girl, a job, a better place in whatever
World is real to Him.
And in a box in some cosmic attic
Your long forgotten character sheet
Will fade to dust, crumpled up against
An old SAT study guide.
But know this, Gary Gygax:
In every memory that still persists
In every fighter, cleric, thief or mage
Reborn upon a line-ruled page
A piece of you comes back to life.
And so we say adieu and thanks
Until we meet again as NPCs.
When you get used to reading inferior books, even a nibble of a great masterpiece can challenge your digestive system in ways that cause stomach cramps. Franz Kafka is no light read. After a diet of heavily processed modern literature, Franz Kafka’s The Trial is as hard to digest as a meal of wholegrain rice and raw vegetables would be to a junk food aficionado. And yet like its gastronomical equivalent, Kafka’s prose stays with you and nourishes you much longer.
Though hard to digest, The Trial is not hard to chew. The prose is in fact deceptively accessible, inviting the reader into a world that is familiar enough, and well rendered enough, to suspend one’s disbelief, despite the many incongruities that make that world so intriguing and so mysterious. This, indeed, is the fine art of surrealism: To lure the reader with hyper-realistically crafted descriptions into the acceptance of things he might otherwise dismiss as simply absurd.
But unlike, say, a Magritte painting, Kafka’s Trial does not stop at flaunting absurdity. Instead, it takes the reader well beyond the ridiculous into something far more dangerous, as we accompany Joseph K., our middle-aged protagonist, on his descent into insanity. We begin our journey in his bedroom, following him into the bank at which he holds a mid-ranking position, into a farcical courtroom and through the various sordid relationships that belie his repressed sexuality. At no point are we sure of what is truly real and what is a projection of his mental illness. Yet the quality of the prose is such that we can glimpse through the cracks in the protagonist’s madness the light of a more solid world; one that is just beyond his grasp, the existence of which is indispensable for us to appreciate what Joseph K. is experiencing.
The narrative device which Kafka uses to set up this surreality is the bureaucracy of a modern judicial system. This is particularly effective for any reader who has had the displeasure of knowing the vagaries of an inefficient and often self-contradictory public administration; in particular, the infuriating functioning of the legal system. Bureaucracies really are insane, which makes it all the easier for us to accept what Joseph K. is going through. Yet we are reminded at regular intervals that this device is only a metaphor, and that the trial, the court which hosts it and the many court attendants we meet throughout the story, are all of the protagonist’s own making.
It’s possible, if one reads about Kafka’s life, to draw parallels and seek explanations for this or that aspect of the book. But I feel doing so adds nothing to the reader’s experience. My best advice is to sit down at the table, clear your palate and take small and deliberate bites.
Yet another Easter is coming around the corner and I find myself thinking, once again, of you. There has, in fact, only ever been one Easter that we have spent together. It was the Easter of 2011. I remember I took you to Mass at Notre Dame au Sablon.
In all the years that have followed, I have always thought of you because Easter is a special time, a time for family.
Your little sister Daphne is thriving. She can’t yet crawl or walk but she scoots around on her bum – very cute. The creche gave her a gift of a few chocolate eggs for Easter but I’m afraid she’s too young to enjoy those kinds of treats (so instead she will have to make do with mushy vegetables and milk!)
I have an Easter egg here for you but as I have no way of giving it to you, I’m afraid I will have to donate it or eat it myself.
Still I hope you get some nice chocolate (but not too much!). I will be thinking of you.
It seems that the public debate is divisive as never before. Left versus right. Social Justice Warriors (whatever they are) versus the alt-right (whatever that is). Admittedly, this impression may simply be a result of our unhealthy addiction to social media, which through its Algorithms of Hate and its cloak of anonymity tends to radicalise latent tendencies. It drives us into tunnels with those who share our vision, while at the same time shielding us from the consequences of our push-button outrage.
Nonetheless, I would contend that the fabric of culture is indeed in the process of tearing. The seams of our civilisation – things like basic human dignity, kindness, respect, humanity and tradition – now seem incapable of holding us together against the pressure of our outrage. The space for reasoned debate seems to shrink with every passing tweet.
A change is as good as the rest
The trouble is that the two sides are not even consistent in their own viewpoints. In the United States, the Democrats – formally defenders of the economically disadvantaged – have somehow come to represent an uneasy alliance between middle- and upperclass privileged ‘Coastals’ and traditional urban ethnic minorities, while the Republicans draw support from the equally awkward bedfellows of the superrich and the underclass of rusting, undereducated, mostly white ‘Heartlanders’. Neither side consistently upholds the values of the left (i.e. a larger state, more redistribution, protection of workers rights) or the right (more free market, less regulation, lower taxes and a smaller state). Members of a group which formally advocated liberal values such as free speech now rally behind brutal authoritarian slogans like “punch a Nazi”, failing to appreciate the irony of their own intolerance.
In Europe, mainstream social democrats increasingly resemble historical anachronisms, while the (Christian democrat) centre-right, desperate to hold on to a collapsing middle, is being overtaken by populists. The CDU in Germany has through the open borders refugee politics of Angela Merkel betrayed many of its own base, while the centre-left’s failure to check the consequences of rising inequality and globalisation constitutes an equal betrayal in the eyes of the old working class faithful. In Britain, the single-issue of Brexit has torn apart both the Conservatives and Labour. In its place, it has forged an unlikely anti-EU alliance between post-industrial working class northerners and well-off village conservationists in the affluent Home Counties which surround the (anti-Brexit) London metropolis. Only yesterday, Italy joined in the fun by voting in populists and extremists and booting out the moderate centre-left. But nothing illustrates the collapse of the old left-right dichotomy as forcefully as the 2017 French presidential election, which saw Emmanuel Macron’s virgin movement sweep aside both the PS and the Gaullists in his ascent to the Elysée throne, although the real victor was Madame l’Absention, followed closely by Madame Le Pen.
New times call for new political structures
The problem is, the model of the old left-right divide has always been missing something important. It was only ever the particular circumstances created by industrialisation which allowed for this one-dimensional approach to work as a good approximation. The left-right split also had the added advantage of convenience, in that the institutions of representative democracy work best when competition for political power is limited to a few, slightly differentiated brands. Being able to position two, three or four parties on a single spectrum reduced the task of political choice to something the masses could participate in without much active engagement or intelligence. The accidental balance created by industrialisation permitted us to overlook the fact that the model we were using to think about society was fundamentally flawed. As the world evolves, that balance is increasingly disturbed. We need to develop a new framework. As the world becomes more complex, so too much our political framework.
But how to adapt the model? Ideas abound; a popular version adds another ‘ecology’ dimension to the old left-right divide. However, in practice, environmentalism is less a coherent ideology and more a loosely grouped set of specific policy challenges. Once you break it down, the solutions to environmental problems can be tackled by taking a position on the conventional left-right spectrum. For instance, if you’re a left-winger, pollution taxes which internalise the externality seem like a good idea; if you’re a right-winger, you might like tradable pollution permits which achieve the same result. Nor does the environment feature particularly strongly in the ideological divide that is tearing the Western world apart at present.
The Social Triangle
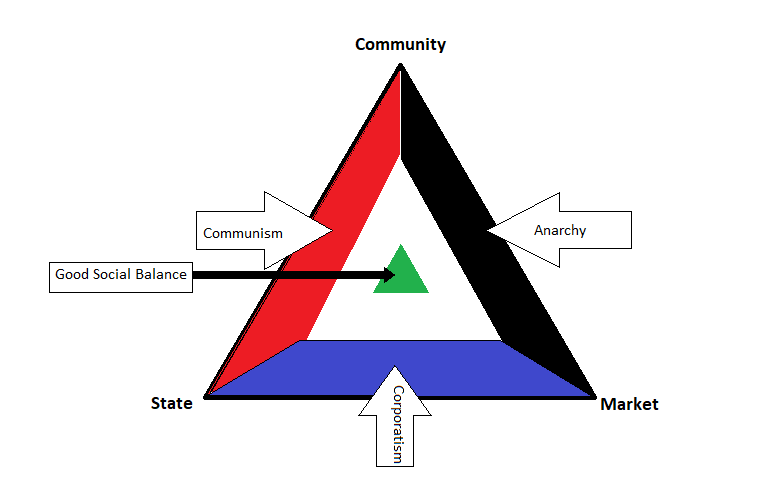
I propose instead a model which takes into account the dimension I feel has been missing. As the diagramme illustrates, we can see society as consisting of three dimensions, the two which are conventionally understood in existing political analysis (the State and the market) and a third, that of community. Community can be understood as the voluntary organisation of people in groups without a specific transactional motivation (which is the market) and without the element of compulsion/threat of violence (which is the state). I argue that the absence of this dimension has, up to now, remained unobserved because we have in essence taken the role of community for granted. It is only as communities collapse – i.e. as society begins to drift ‘downwards’ towards the bottom side of the triangle – that we notice its absence. It is marked by a tendency towards the unholy alliance between the state and the market, in the form of corporatism.
Bowling alone
When looked at this way, society can be properly understood to be positioned somewhere within the above triangle. Societies that are more communistic can be placed within the red area of the triangle; those that are more anarchistic within the black area; and those that are more corporatist within the blue area. An ideally functioning society, like a three-legged table, balances all three dimensions and ends up somewhere in the green centre. Of course, in today’s world, we are observing a collapse of community – a massive drop-off in religious subscriptions, fewer bowling clubs, the death of the Boy Scouts, etc. and so we have drifted downwards, further towards corporatism. In such a world, the negative effects of the free market become more apparent as, for instance, the lack of community leads to an erosion of business ethics. But equally, a lack of community (for instance in the form of charities) heightens reliance on state-provided forms of welfare, revealing the innate corruption and incompetence of the state’s bureaucracy. Supporters of Donald Trump scream at supporters of Hillary Clinton and vice versa, but in the end, they are both suffering from the same affliction; a lack of community. The rise of populism is not a cry for more or less free market, nor is it a cry for a bigger or smaller role of the state. It is a cry for more community.
Which leads to the next question: What is leading to the erosion of community and how can we reverse this? That is perhaps the subject of another blogpost.
This is just a brief one to wish you a very happy birthday. You are seven today; a big boy now!
I want you to know that although I can’t spend the day with you, I have been thinking about you all day. I miss you more than you can know, and look forward to the day when, one day, I can be there with you on your birthday.
It’s a few days after Christmas and I’m here at home thinking once again about you. My Christmas has been very merry indeed – with lots of family and friends and games and fun and good food (more about that in a second). But of course, everything is tinged with sadness because you are not here with us, and I wish you were.
Our Christmas tree is magnificent – two metres tall and bushy and perfectly formed. We have loaded it with ornaments and lights and it is in the corner of the dining room, with plenty of space for Christmas presents. Next to the tree, I have set up the Nativity scene on the sill of the dining room window. It is the set of figurines I inherited from your Irish grandmother, who is with the angels in heaven now. I’m sure she is very pleased to look down and see that I still set it up every Christmas.
It was also very popular this Christmas morning. Our visitors included a little girl your age, who duly turned over the baby Jesus when she came out of her room and sang ‘Away in the Manger’, which is a family tradition.
Then there were presents! We unwrapped tonnes of gifts (I got a lovely coat from Jo, which I have been wearing every day since). The children were all delighted with the gifts Santa had brought (they even caught a glimpse of him out the window on Christmas Eve!) and ran around the house like mad people, playing with everything and eating far too many sugary things. Then, later on, we ate a delicious meal of turkey, chicken, ham, stuffing, brussels sprouts, broccoli, turnip, mashed potato, roast potato, turnip, gravy, cranberry sauce and bread sauce. And for dessert we had Yule Log and chocolate cake and chocolate pralines. It was amazing!
What about you? Did Santa come to you? Did you get nice gifts? Did you have good food? I hope so, my dear son. I hope you had an excellent, merry Christmas and are doing well.
I miss you so much. My heart is as always full of love for you, and for Anna and Daphne. I hope 2018 is the year when I get to see you again.
Hi, it’s your dad again. It’s been a number of days since the last hearing in the courts and I have been thinking about you all the time.
I heard that you are doing pretty well in school – well that’s good news. I hope your teacher is nice and that you are making lots of friends.
Life is sometimes really confusing and people will tell you different things. But beyond all that, there is something called the truth. And the truth is this:
You are my son, and I love you. I have only ever cared for you and wanted to protect you and be in your life. That will never change. I will continue to fight for you so that you can have your father and know who you are: A young man with an entire family who loves you and will be there for you, one day, when you are old enough to choose that for yourself.
Until that day, I will keep fighting and keep making sure that you know your dad is out there, trying his best to be there for you.
This post is an attempt to come up with a Law on the fundamental nature of power, which I call ‘Aragorn’s Law’. To begin with, we state three propositions.
Proposition One: That Power is about control
It’s possible to define the concept of power in a few different ways, but for the most part, when we think of someone who is powerful, we think of a person who has control, meaning they can make choices. A horse remains a ‘strong’ animal even with a rider on its back, but it is no longer powerful, when it is wholly under the control of the rider. That’s because the rider can steer the animal, bending its force to his human will. In a sense, a skilled rider assumes the strength of the beast he controls, taking from it its power.
The same principle holds in human relationships too. Powerful people are those who have control over others, who can make choices and enforce their will upon their subordinates. The boss of a company, the mother of a child, the leader of a country, the dominant spouse in a marriage – these are all clear examples of people who have control over other people and are thus powerful. For simplicity’s sake, let’s just call them kings.
Proposition Two: That Goodness exists and means doing good
What we’ve said so far is nothing very earth shattering. In fact, it’s pretty close to tautological. Ditto for what I’m about to say concerning a ‘good’ person: A ‘good’ person is one who tries to do good. This is pretty uncontroversial, unless you take the position that goodness is something innate – i.e. that you simply are (or are not) good or else the nihilist position, that good does not really exist, and that there is only subjective self-interest.
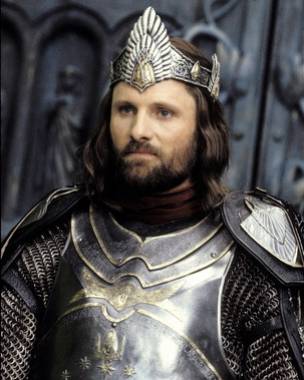
Tolkien’s fictional king Aragorn is the archetype of the powerless ruler – slave to his desire to do good.
But if you accept – as I do – that there is such a thing as free will, and that there is such a thing as objective ‘goodness’, then it follows pretty logically that a good person is one who makes the choice to do good things; and a good king is a king who chooses to do good. The boss can do good by paying his workers fairly, setting an example of industry and honesty and settling disputes in a tough but equitable way. The mother can give to her children equal shares of love and attention, care for their needs and protect them from harm. The political leader can attempt to reform his country, restrain the power of the oligarchs and promote the prosperity of his people. Even the dominant spouse can do good, by refraining from using her power over her partner in an adverse way and by guiding him to be a stronger, better individual.
Proposition Three: That the Best Path exists
Now follows the final proposition in the argument: If there exists such a thing as good, then there exists its logical extreme, ‘best’. Insofar as achieving ‘best’ requires choices, there is one path (though often unknown) which is always the Best Path to achieving it. This is a little more tenuous, I’ll admit. You might argue that there could be two equally good outcomes, in which case there might be two separate paths to get us there. But in general, I believe the proposition to hold in most cases, if not in all. It is ‘good’ for the people to be enfranchised, educated, live in peace and pursue their own goals, and there is one ‘best’ outcome for them, their families and society. Even if a king is benevolent, he might not know exactly what the path is to achieve these goals, but he knows that among all the choices he could make, there is one unique set of choices which will guide him and his people as close to this goal as is possible.
In a world free of morality, a king might have infinitely man choices, but Proposition Three reduces his choices to two: Either he follows, to the best of his ability, the path of good, the Best Path, or he does not.
The Return of the King
Now we can put these three propositions together to formulate our law, which I name after Tolkien’s fictional King of Gondor, Aragorn. Aragorn’s Law states that:
“There are good kings, and there are powerful kings. But there is no such thing as a good king who is also powerful.”
This is so because in order to do good, a king is infinitely constrained in his actions. Every choice he faces is, in effect, a choice between staying on the Best Path, or deviating from it. As long as he always remains on the Best Path, he has no control whatsoever and is, according to Proposition One, effectively powerless.
A restatement of Aragorn’s Law is instructive in how we view the role of a leader. If power and good leadership are contradictory, then anyone who seeks to have power, cannot be good. This gets us to the fundamental problem with politics, which is that we are ruled by the powerful. It is worthwhile for all of us – and particular those of us in positions of authority, to reflect on what it means to be a good king, a good boss, a good parent or even a good friend. You are never free to do what you want, if freedom to choose means the freedom to deviate.
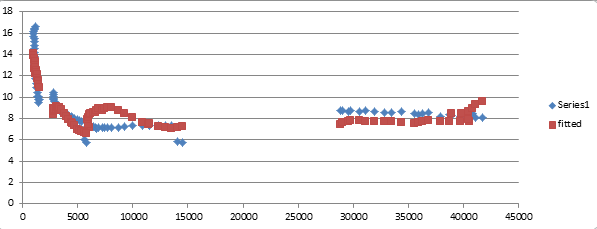
As with birth rates, we use data for 4 categories of countries from 1990 to 2015 (100 observations total). We have two explanatory variables, AGE and Y, where AGE is defined as the percentage of the population aged over 65 and Y is per capita GDP.
After eyeballing the scattergrams, we test the following functional form:
d = (minY^a)/Y^a * (1/AGE^g)
Where minY is the constant equal to the smallest value of Y in the series.
Logarithmic transformation gives:
ln(d) = ln(minY^a) – a*ln(Y) – g*ln(AGE)
which we test on the data using OLS. Here are the results:
Adjusted R square: 75.191
Intercept coefficient: 7.37384
t-Stat: 20.4011
Y coefficient: -1.01444
t-Stat: -13.1059
AGE coefficient: 2.0097
t-Stat: 11.5208
The estimated intercept is a good, but not perfect, approximation of ln(minY^a)
Here are the fitted against actual values of the scattergram for death rate against per capita GDP:
While the results are not as good as with the birth rates calculations, it is nevertheless a good enough fit and the explanatory variables have a strong enough confidence factor to be usable in our estimations.
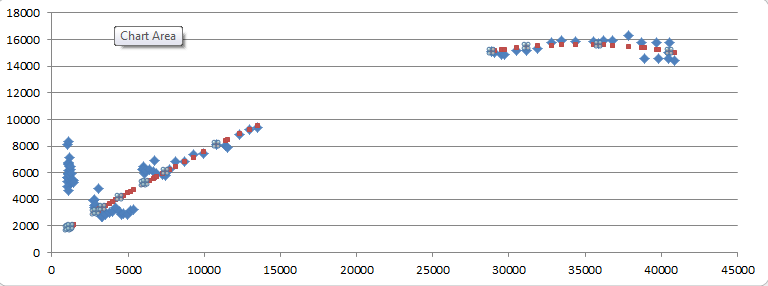
We begin by examining the scatter of data for 100 observations of per capita GDP and per capita emissions for 4 categories of countries, over 25 years (1990 – 2015).
The scatter suggests a cubic functional form, so we test:
GHG = a + b*Y + c*Y^2 + d*Y^3
where GHG are per capita emissions of GHG, and Y is per capita GDP.

 model which takes into account the dimension I feel has been missing. As the diagramme illustrates, we can see society as consisting of three dimensions, the two which are conventionally understood in existing political analysis (the State and the market) and a third, that of community. Community can be understood as the voluntary organisation of people in groups without a specific transactional motivation (which is the market) and without the element of compulsion/threat of violence (which is the state). I argue that the absence of this dimension has, up to now, remained unobserved because we have in essence taken the role of community for granted. It is only as communities collapse – i.e. as society begins to drift ‘downwards’ towards the bottom side of the triangle – that we notice its absence. It is marked by a tendency towards the unholy alliance between the state and the market, in the form of corporatism.